LGBTQ+ Equality Project
Health & Safety of LGBTQ+ Youth
Health & Safety of LGBTQ+ Youth
Net LGBTQ+ Youth Climate Score
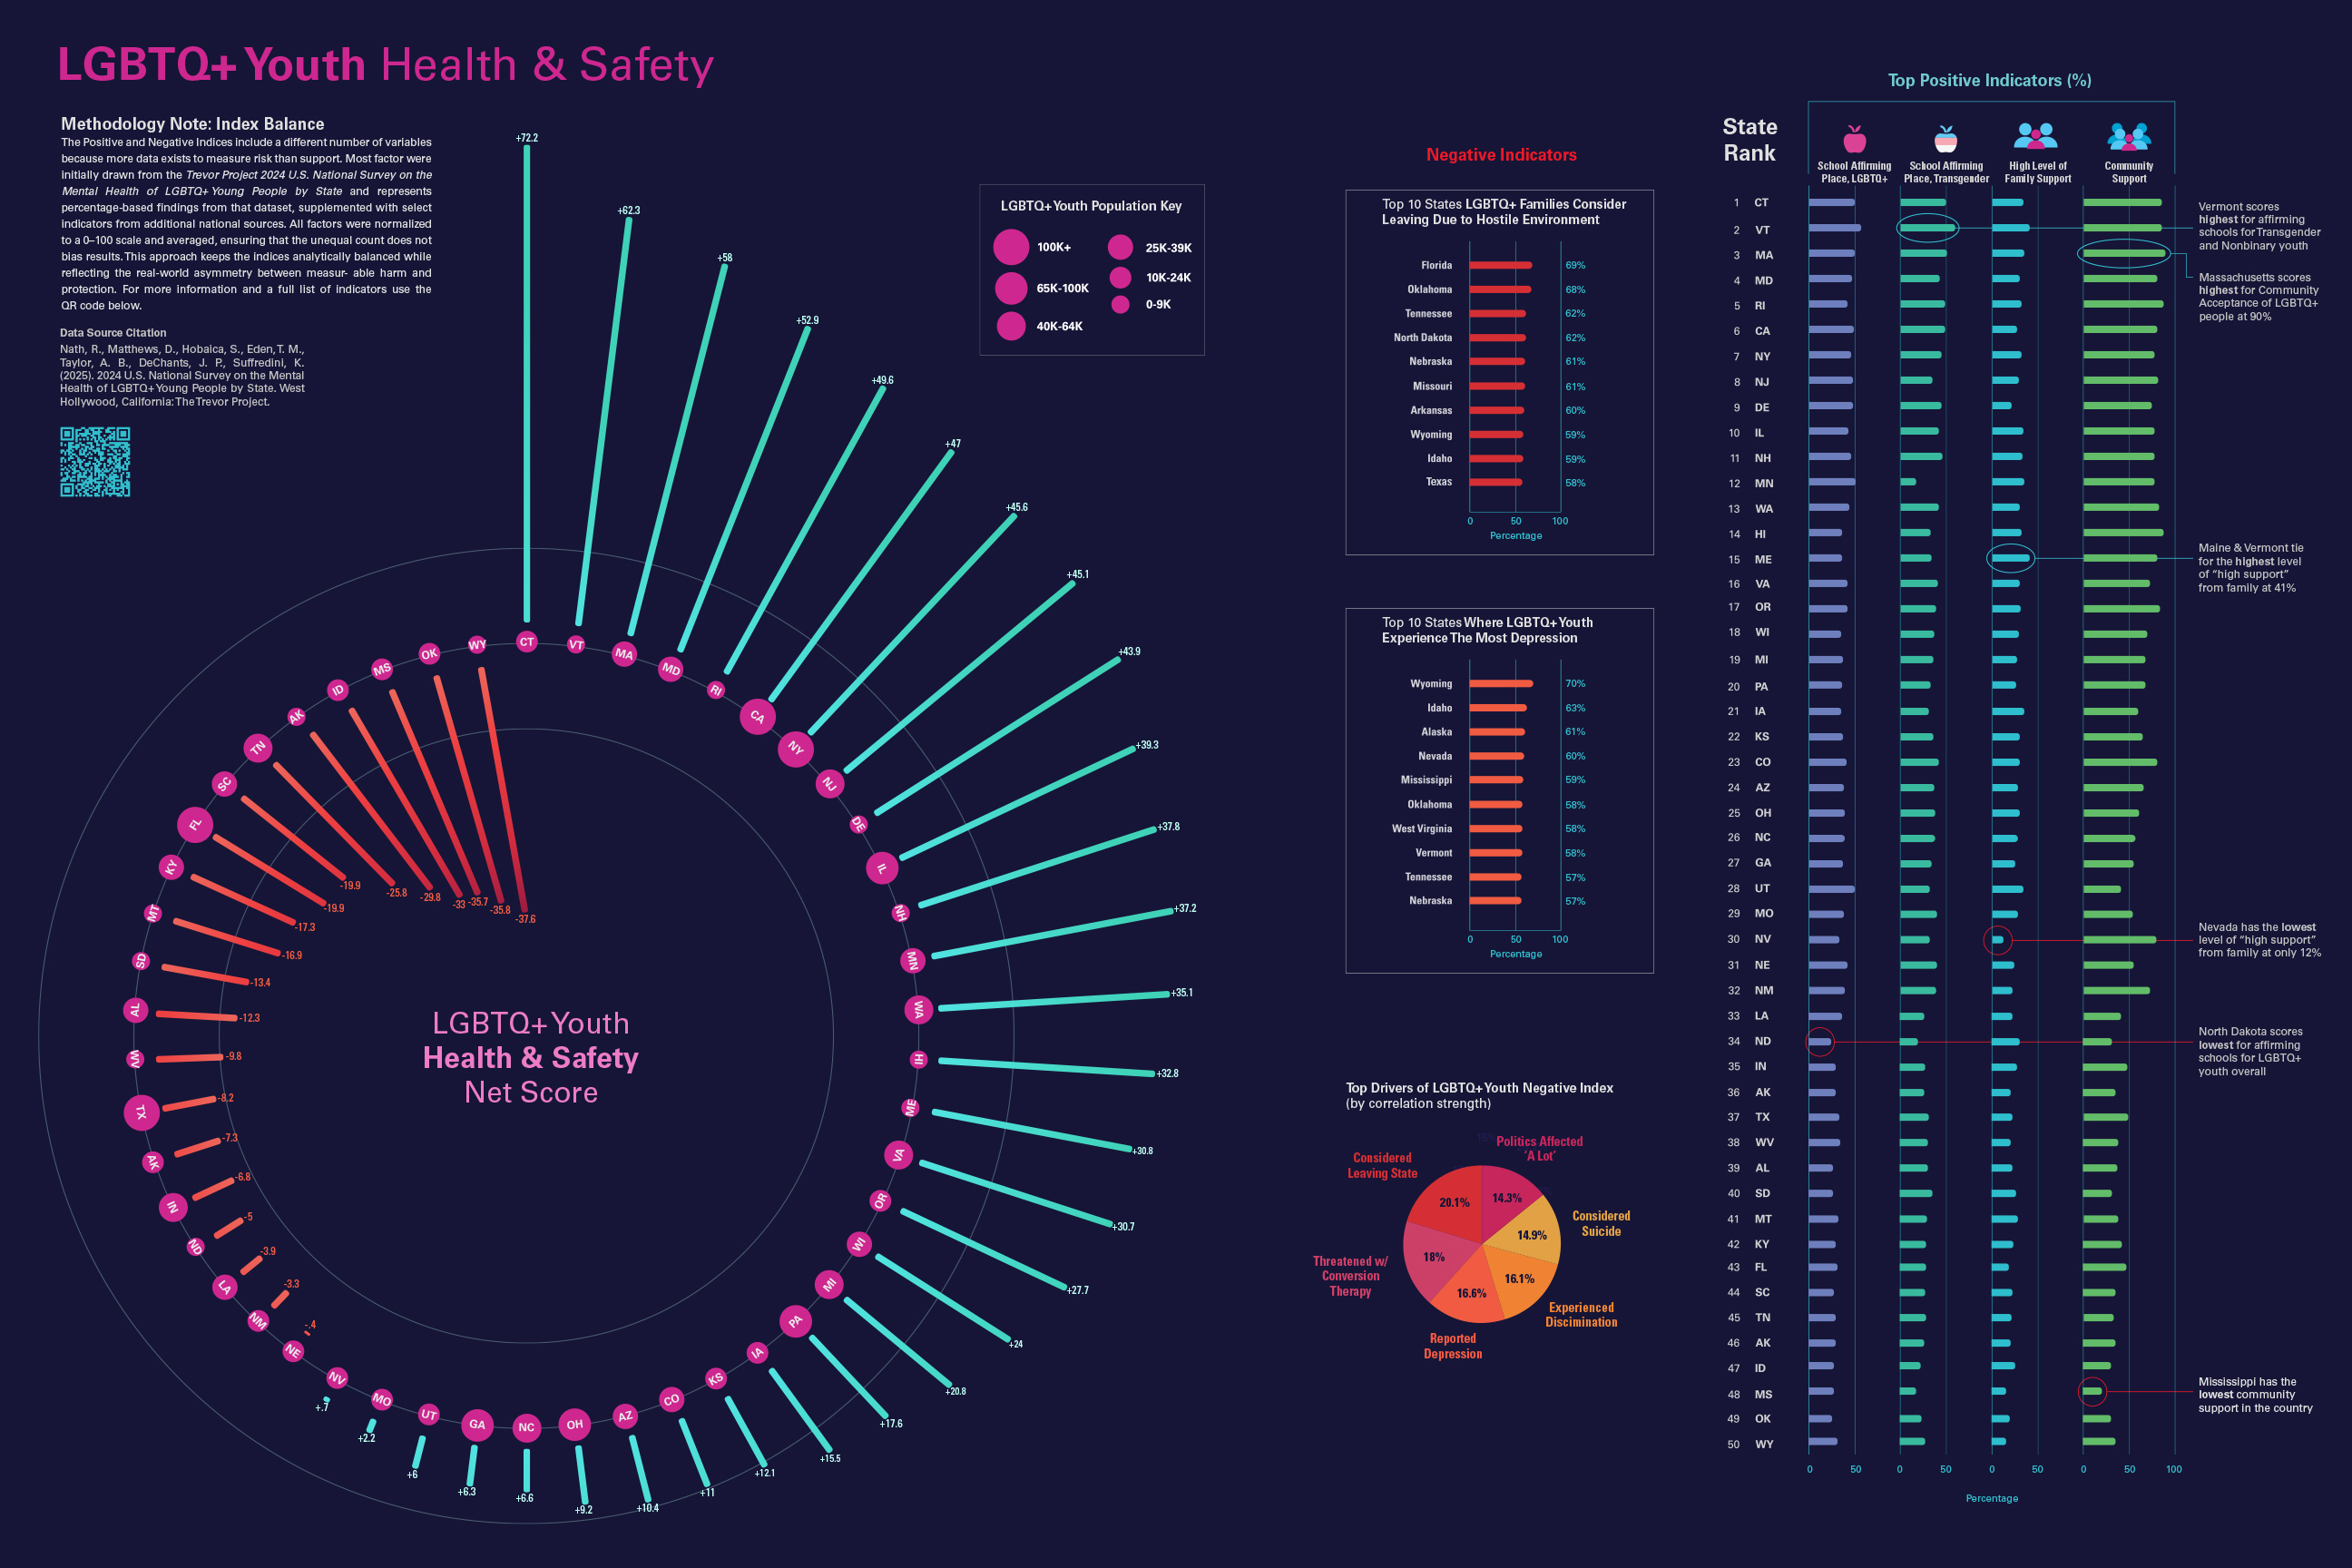
The Net LGBTQ+ Youth Climate Score reflects the overall state environment of positive variables minus negative variables. The higher the climate score the more supportive anad affirming the state. Note that the more hostile states scored a negative number.
While the underlying data draws mainly from The Trevor Project's 2024 U.S. National Survey on the Mental Health of LGBTQ+ Young People by State, the Positive and Negative Indices and the overall ranking methodology were independently developed to measure how policy, environment, and support systems shape LGBTQ+ youth's well-being state by state. These indices are focused on mental-health outcomes, experiences of discrimination, family support, community acceptance, and protective factors, allowing for clear comparative visualizations across states.
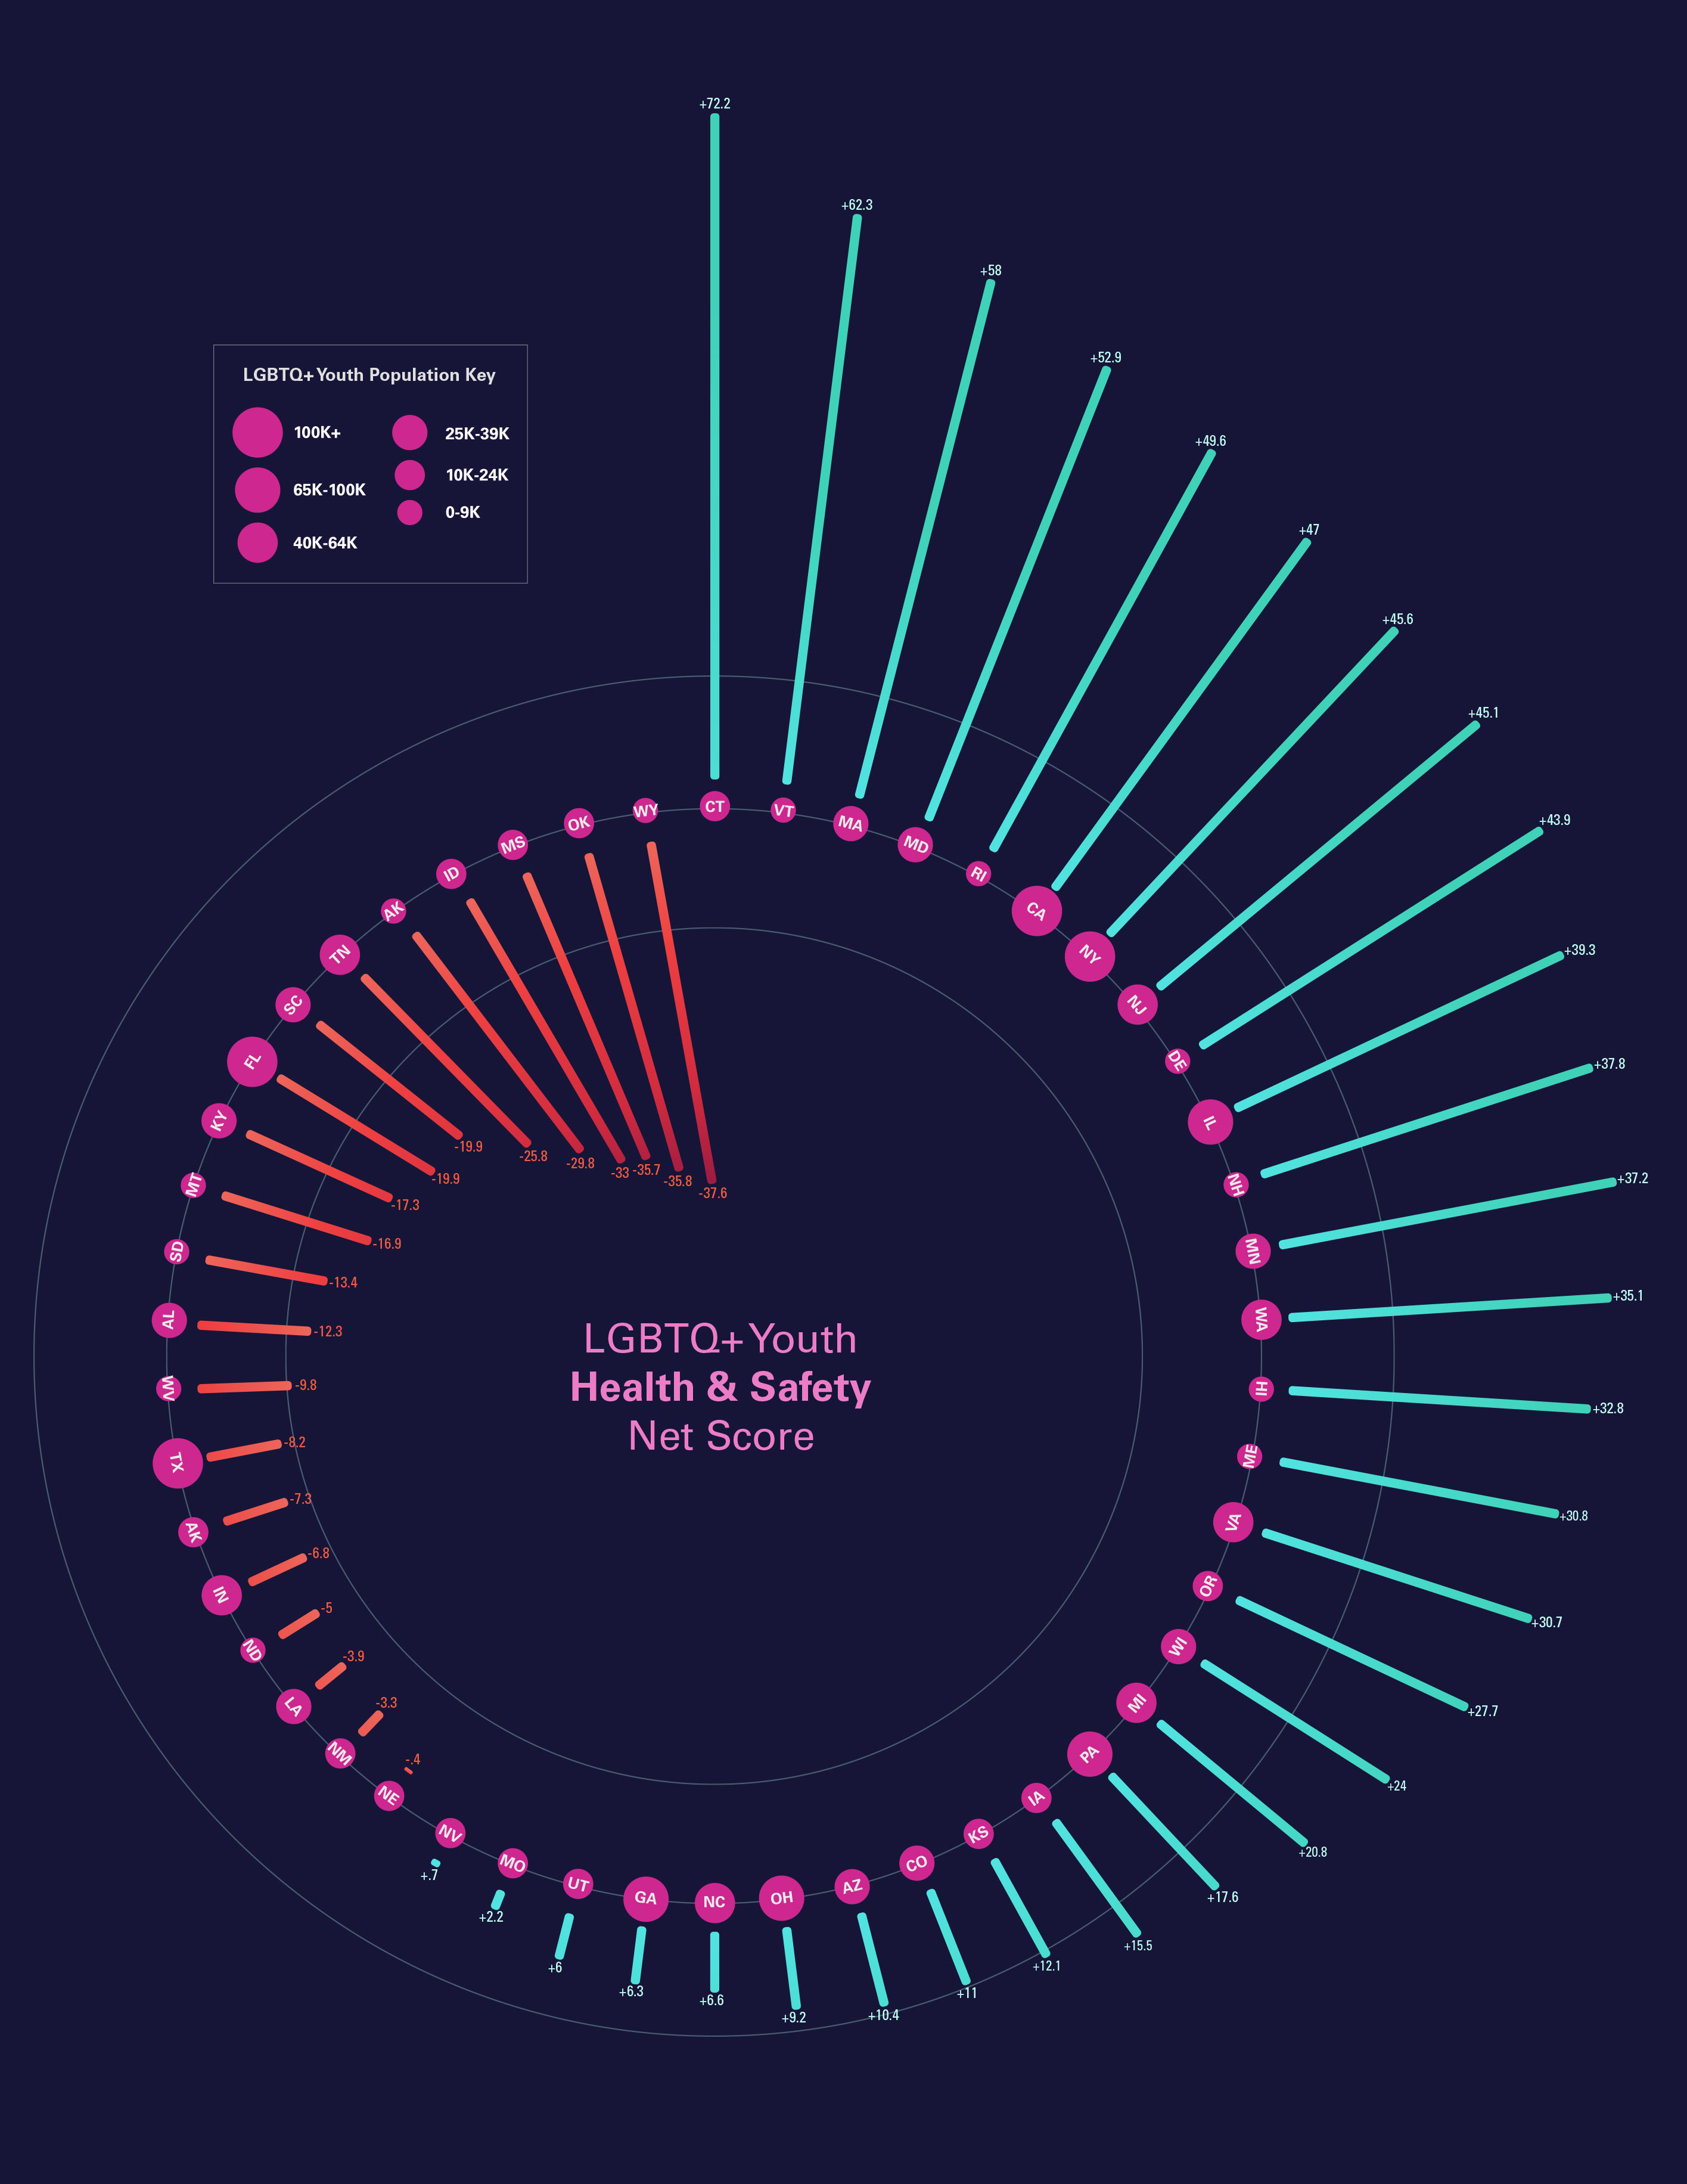
The aim is to show a composite lived-risk index with a combined measure of how hostile a state is and how much that hostility translates to harm. This reflects the total burden of hostility with outcomes and effects of both a hostile/unsupportive environment and the structural/social causes. As such the Negative Index also includes outcomes such as mental health and discrimination variables that reflects the total human impact of hostility.
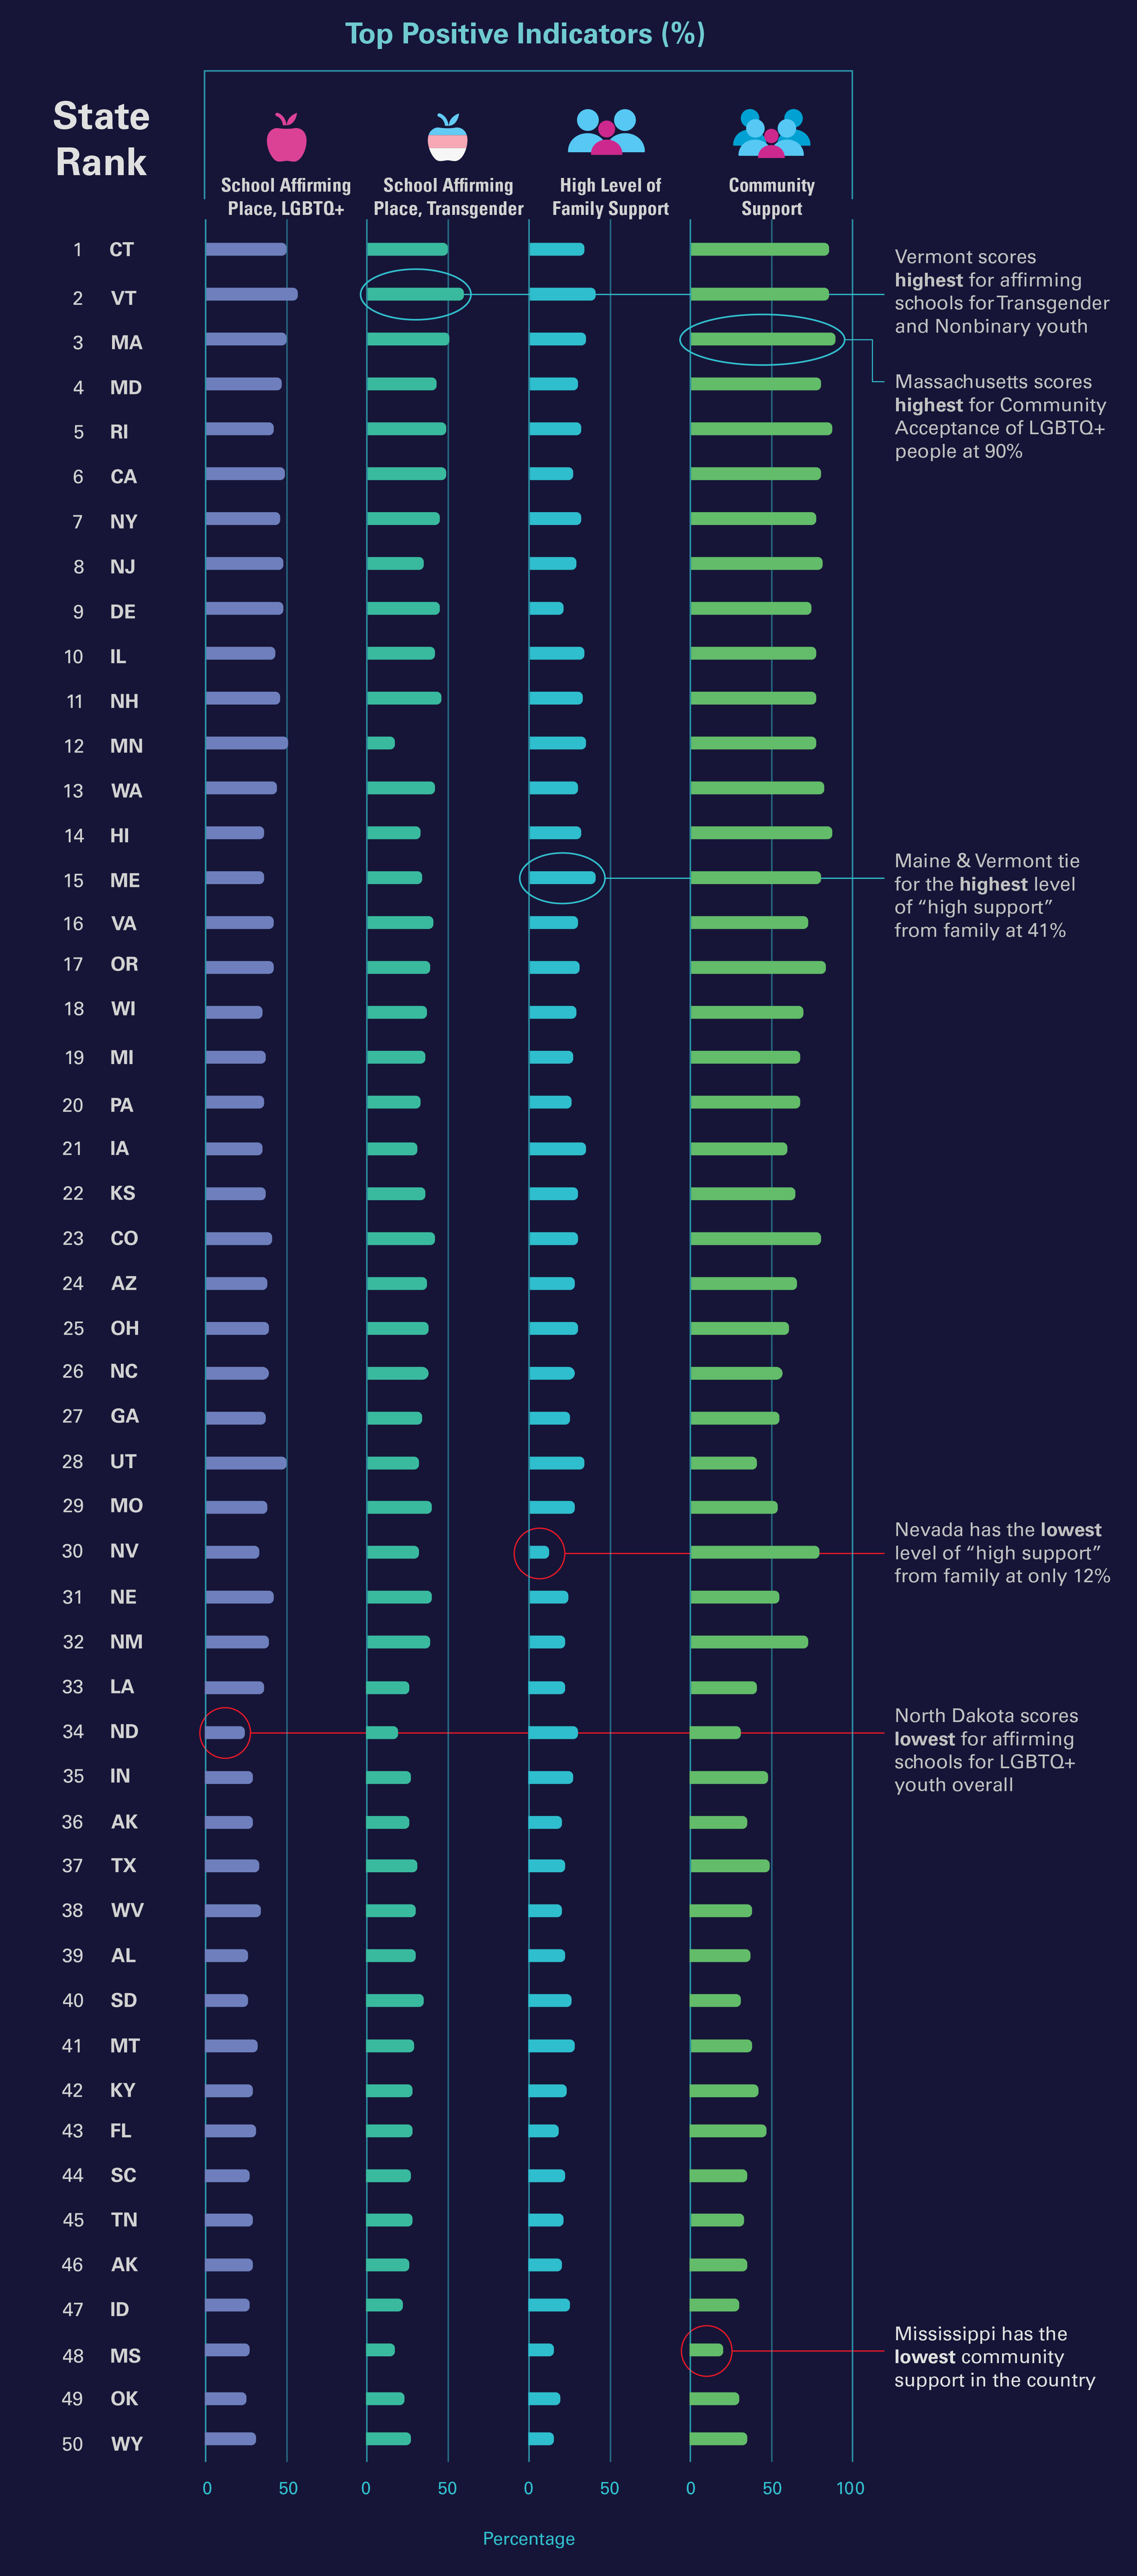
The Positive Index measures the overall level of support and affirmation for LGBTQ+ youth in each state to which they experience supportive, affirming conditions in their daily lives. Rather than measuring policy or risk, this score reflects the presence of protective resources such as affirming school climates, welcoming communities, and reliable interpersonal supports that research shows can significantly improve mental-health outcomes and overall well-being. A higher Positive Index signals environments where LGBTQ+ youth are more likely to feel seen, valued, and connected, offering insight into the places where supportive systems are strongest and where they may serve as models for other states and regions.
The Positive and Negative Indices include a different numbers of variables because more data was considered (and is available) for risk than support. Most factors were initially drawn from the Trevor Project's 2024 U.S. National Survey on the Mental Health of LGBTQ+ Young People by State (percentage-based findings), supplemented with one additional indicator from the Human Rights Campaign's 2024 State Equality Index. All factors were then normalized to a 0–100 scale and averaged, ensuring that the unequal count does not bias results. This approach keeps the indices analytically balanced while reflecting the real-world asymmetry between measurable harm and protection. Each variable was also normalized because they (family support, policies passed, depression, etc.) have different numeric ranges.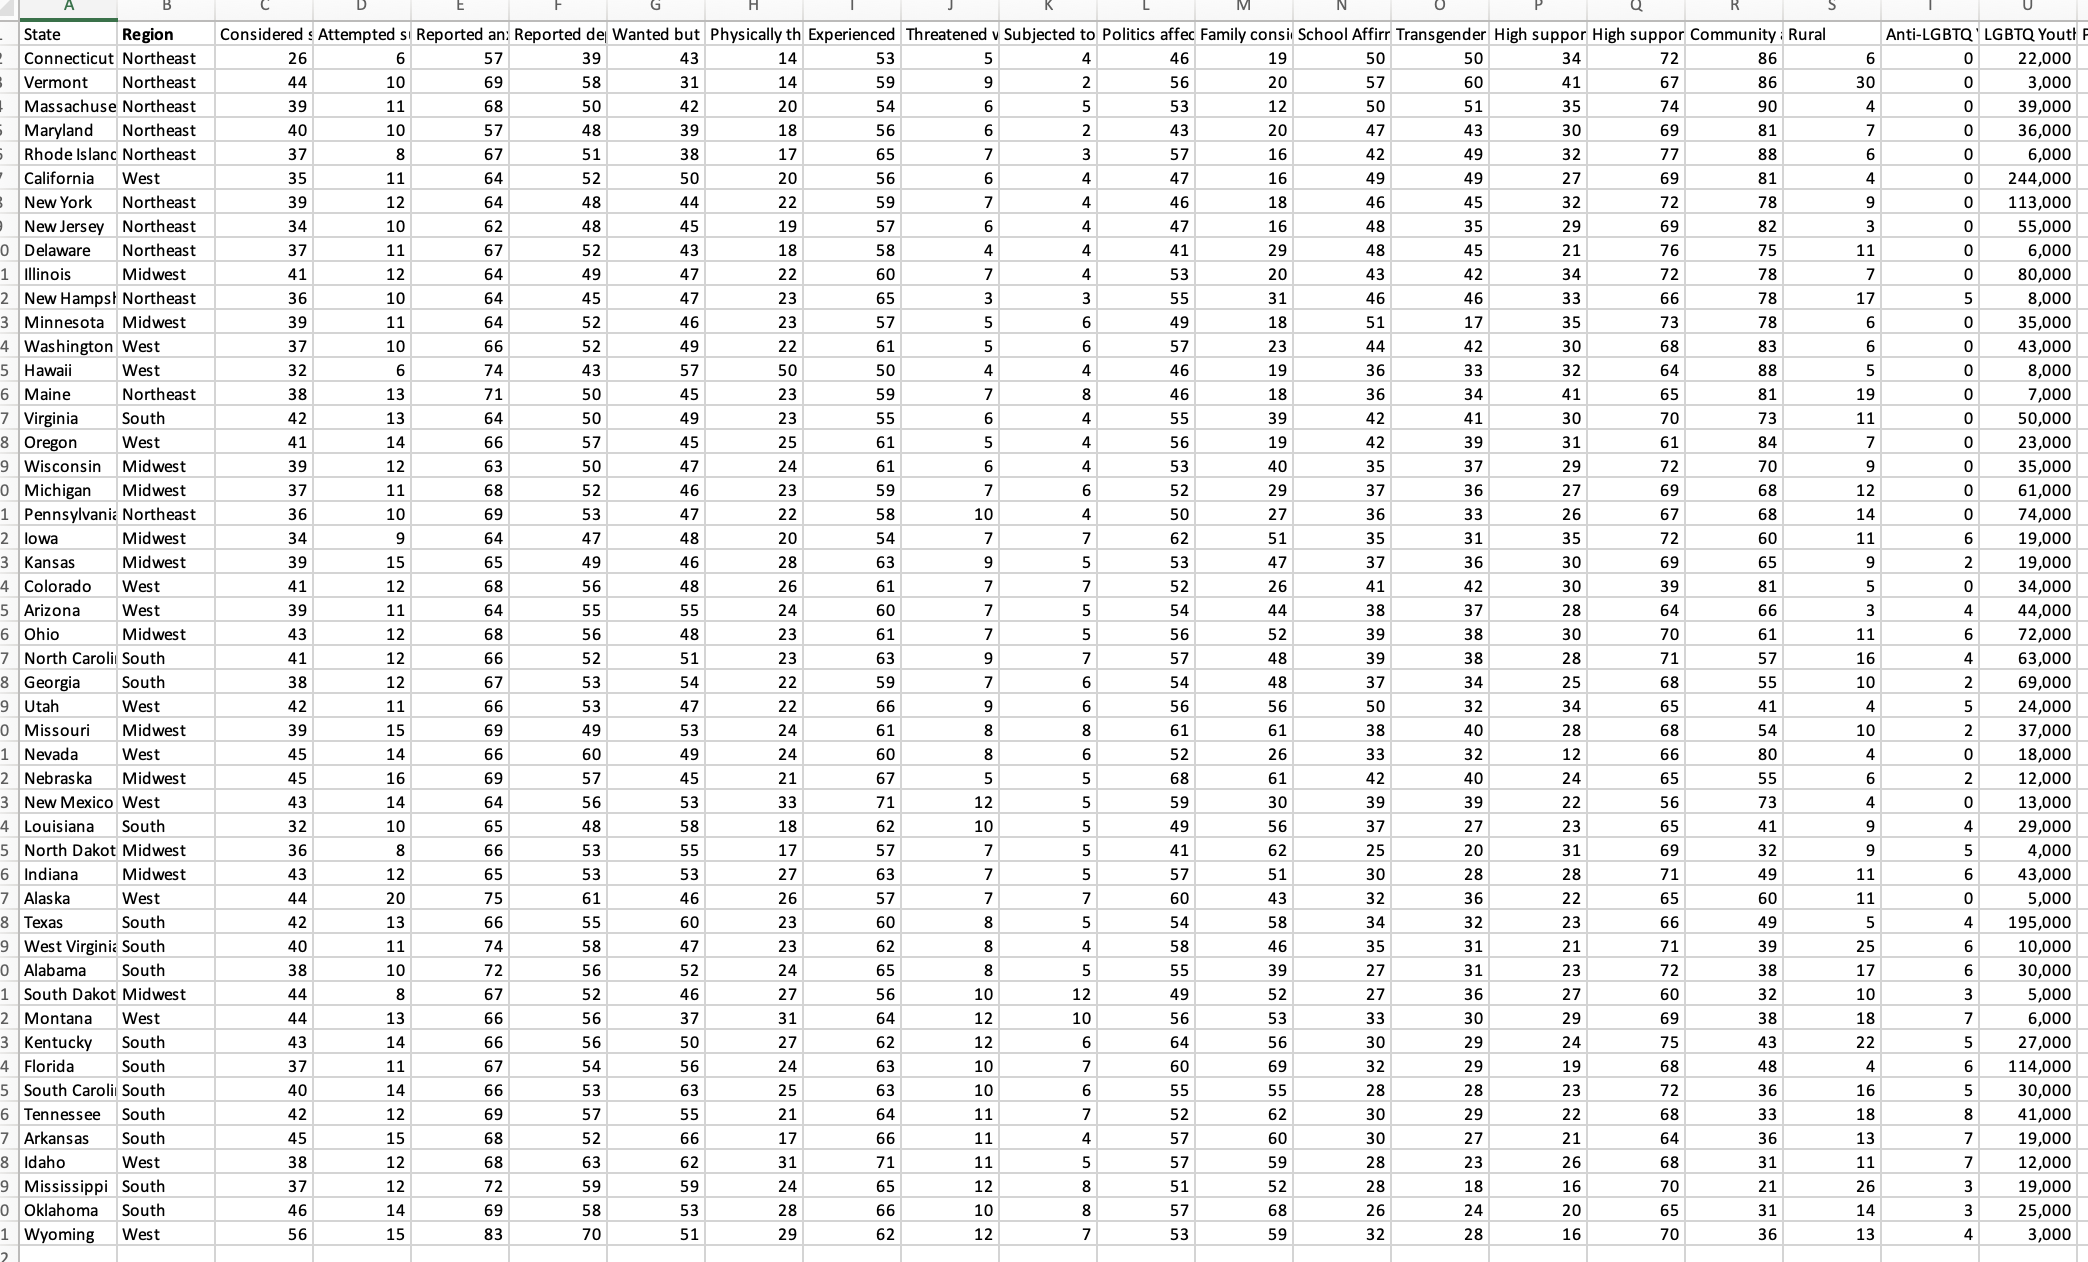
In addition, LGBTQ+ youth population numbers per state show the human scale of each state’s impact, whether positive or negative. California, Texas, Florida, New York, and Illinois have the largest LGBTQ+ youth populations (13–17). But those states sit at very different ends of the Net Climate Index Ranking. So for example, even though California and Texas both have huge numbers of LGBTQ+ youth, the lived experience in those states diverges dramatically.
The Net LGBTQ+ Youth Climate Score reflects the overall state environment of positive variables minus negative variables. The higher the climate score the more supportive anad affirming the state. Note that the more hostile states scored a negative number.
While the underlying data draws mainly from The Trevor Project's 2024 U.S. National Survey on the Mental Health of LGBTQ+ Young People by State, the Positive and Negative Indices and the overall ranking methodology were independently developed to measure how policy, environment, and support systems shape LGBTQ+ youth's well-being state by state. These indices are focused on mental-health outcomes, experiences of discrimination, family support, community acceptance, and protective factors, allowing for clear comparative visualizations across states.
- The states ranked from most supportive → least supportive (Positive Index)
- The states ranked from least hostile → most hostile (Negative Index)
The aim is to show a composite lived-risk index with a combined measure of how hostile a state is and how much that hostility translates to harm. This reflects the total burden of hostility with outcomes and effects of both a hostile/unsupportive environment and the structural/social causes. As such the Negative Index also includes outcomes such as mental health and discrimination variables that reflects the total human impact of hostility.
Variables
|
Source |
The Positive Index measures the overall level of support and affirmation for LGBTQ+ youth in each state to which they experience supportive, affirming conditions in their daily lives. Rather than measuring policy or risk, this score reflects the presence of protective resources such as affirming school climates, welcoming communities, and reliable interpersonal supports that research shows can significantly improve mental-health outcomes and overall well-being. A higher Positive Index signals environments where LGBTQ+ youth are more likely to feel seen, valued, and connected, offering insight into the places where supportive systems are strongest and where they may serve as models for other states and regions.
Variables
|
Source |
| Rank | State | Positive Index | Negative Index | Net LGBTQ+ Climate Score |
|---|---|---|---|---|
| 1 | Connecticut | 82.36 | 10.13 | +72.22 |
| 2 | Vermont | 93.58 | 31.26 | +62.32 |
| 3 | Massachusetts | 85.72 | 27.65 | +58.08 |
| 4 | Maryland | 71.44 | 18.47 | +52.97 |
| 5 | Rhode Island | 78.72 | 29.05 | +49.67 |
| 6 | California | 73.41 | 26.39 | +47.02 |
| 7 | New York | 73.83 | 28.15 | +45.68 |
| 8 | New Jersey | 67.94 | 22.77 | +45.17 |
| 9 | Delaware | 68.73 | 24.77 | +43.96 |
| 10 | Illinois | 71.94 | 32.54 | +39.40 |
| 11 | New Hampshire | 71.83 | 34.00 | +37.83 |
| 12 | Minnesota | 66.53 | 29.29 | +37.24 |
| 13 | Washington | 69.15 | 34.05 | +35.10 |
| 14 | Hawaii | 60.69 | 27.87 | +32.81 |
| 15 | Maine | 65.86 | 35.06 | +30.80 |
| 16 | Virginia | 65.59 | 34.88 | +30.71 |
| 17 | Oregon | 63.80 | 36.07 | +27.73 |
| 18 | Wisconsin | 58.85 | 34.79 | +24.05 |
| 19 | Michigan | 56.09 | 35.20 | +20.90 |
| 20 | Pennsylvania | 52.33 | 34.72 | +17.61 |
| 21 | Iowa | 57.30 | 41.73 | +15.57 |
| 22 | Kansas | 57.29 | 45.15 | +12.14 |
| 23 | Colorado | 51.43 | 40.34 | +11.10 |
| 24 | Arizona | 54.66 | 44.19 | +10.47 |
| 25 | Ohio | 58.84 | 49.82 | +9.02 |
| 26 | North Carolina | 56.83 | 50.21 | +6.62 |
| 26 | Georgia | 49.49 | 43.17 | +6.32 |
| 28 | Utah | 57.26 | 51.24 | +6.02 |
| 29 | Missouri | 54.69 | 52.47 | +2.22 |
| 30 | Nevada | 43.29 | 42.54 | +0.75 |
| 31 | Nebraska | 53.14 | 53.55 | −0.41 |
| 32 | New Mexico | 49.90 | 53.29 | −3.39 |
| 33 | Louisiana | 39.22 | 43.20 | −3.98 |
| 34 | North Dakota | 33.48 | 38.52 | −5.05 |
| 35 | Indiana | 44.23 | 51.12 | −6.89 |
| 36 | Alaska | 45.10 | 52.41 | −7.31 |
| 37 | Texas | 42.51 | 50.79 | −8.27 |
| 38 | West Virginia | 41.03 | 50.84 | −9.81 |
| 39 | Alabama | 37.64 | 50.01 | −12.36 |
| 40 | South Dakota | 34.67 | 48.11 | −13.44 |
| 41 | Montana | 43.49 | 60.46 | −16.97 |
| 42 | Kentucky | 42.31 | 59.64 | −17.33 |
| 43 | Florida | 37.87 | 57.79 | −19.92 |
| 44 | South Carolina | 36.29 | 56.25 | −19.96 |
| 45 | Tennessee | 34.34 | 60.20 | −25.86 |
| 46 | Arkansas | 31.49 | 61.35 | −29.86 |
| 47 | Idaho | 32.48 | 65.54 | −33.06 |
| 48 | Mississippi | 21.41 | 57.14 | −35.72 |
| 49 | Oklahoma | 25.98 | 61.83 | −35.85 |
| 50 | Wyoming | 32.91 | 70.59 | −37.68 |
The Positive and Negative Indices include a different numbers of variables because more data was considered (and is available) for risk than support. Most factors were initially drawn from the Trevor Project's 2024 U.S. National Survey on the Mental Health of LGBTQ+ Young People by State (percentage-based findings), supplemented with one additional indicator from the Human Rights Campaign's 2024 State Equality Index. All factors were then normalized to a 0–100 scale and averaged, ensuring that the unequal count does not bias results. This approach keeps the indices analytically balanced while reflecting the real-world asymmetry between measurable harm and protection. Each variable was also normalized because they (family support, policies passed, depression, etc.) have different numeric ranges.
In addition, LGBTQ+ youth population numbers per state show the human scale of each state’s impact, whether positive or negative. California, Texas, Florida, New York, and Illinois have the largest LGBTQ+ youth populations (13–17). But those states sit at very different ends of the Net Climate Index Ranking. So for example, even though California and Texas both have huge numbers of LGBTQ+ youth, the lived experience in those states diverges dramatically.
- California (+47) → supportive
- New York (+46) → supportive
- Illinois (+39) → positive but moderate
- Texas (−8) and Florida (−20) → highly hostile climates
LGBTQ+ Youth Health & Safety Design 1
This design focuses on the Net Climate Ranking and the Negative and Positive indices. A spiral form was created to demonstrate the variance between the states' positive and negative numbers. The spiral form strengthens the visualization by transforming a long, linear ranking into an engaging, continuous narrative arc. Unlike a standard bar chart, the spiral organizes all 50 states in a fluid, circular spectrum highlighting patterns and extremes for greater "at a glance" clarity. It creates a natural visual polarity between the upward, positive scores and the inward, negative ones, while the open center provides a focal point for the core message. The result is a form that is not only efficient for handling dense data, but also emotionally resonant, memorable, and uniquely suited to expressing the continuum of LGBTQ+ youth climate across the United States.
This design focuses on the Net Climate Ranking and the Negative and Positive indices. A spiral form was created to demonstrate the variance between the states' positive and negative numbers. The spiral form strengthens the visualization by transforming a long, linear ranking into an engaging, continuous narrative arc. Unlike a standard bar chart, the spiral organizes all 50 states in a fluid, circular spectrum highlighting patterns and extremes for greater "at a glance" clarity. It creates a natural visual polarity between the upward, positive scores and the inward, negative ones, while the open center provides a focal point for the core message. The result is a form that is not only efficient for handling dense data, but also emotionally resonant, memorable, and uniquely suited to expressing the continuum of LGBTQ+ youth climate across the United States.
Size: 36"x24" printed
LGBTQ+ Youth Health & Safety Design 2
This design focuses on regional comparisons and key state-versus-state comparisons. Several types of charts and graphs give viewers a better understanding of the factors and places where LGBTQ+ youth can feel more secure, supported and generally safe.
About the Process: First, data was researched, collected and formatted in Excel spreadsheets. Next, Flourish was used to intially visualize the radar charts and chord diagrams. Further work on the infographics and overall design was completed in Adobe Illustrator.
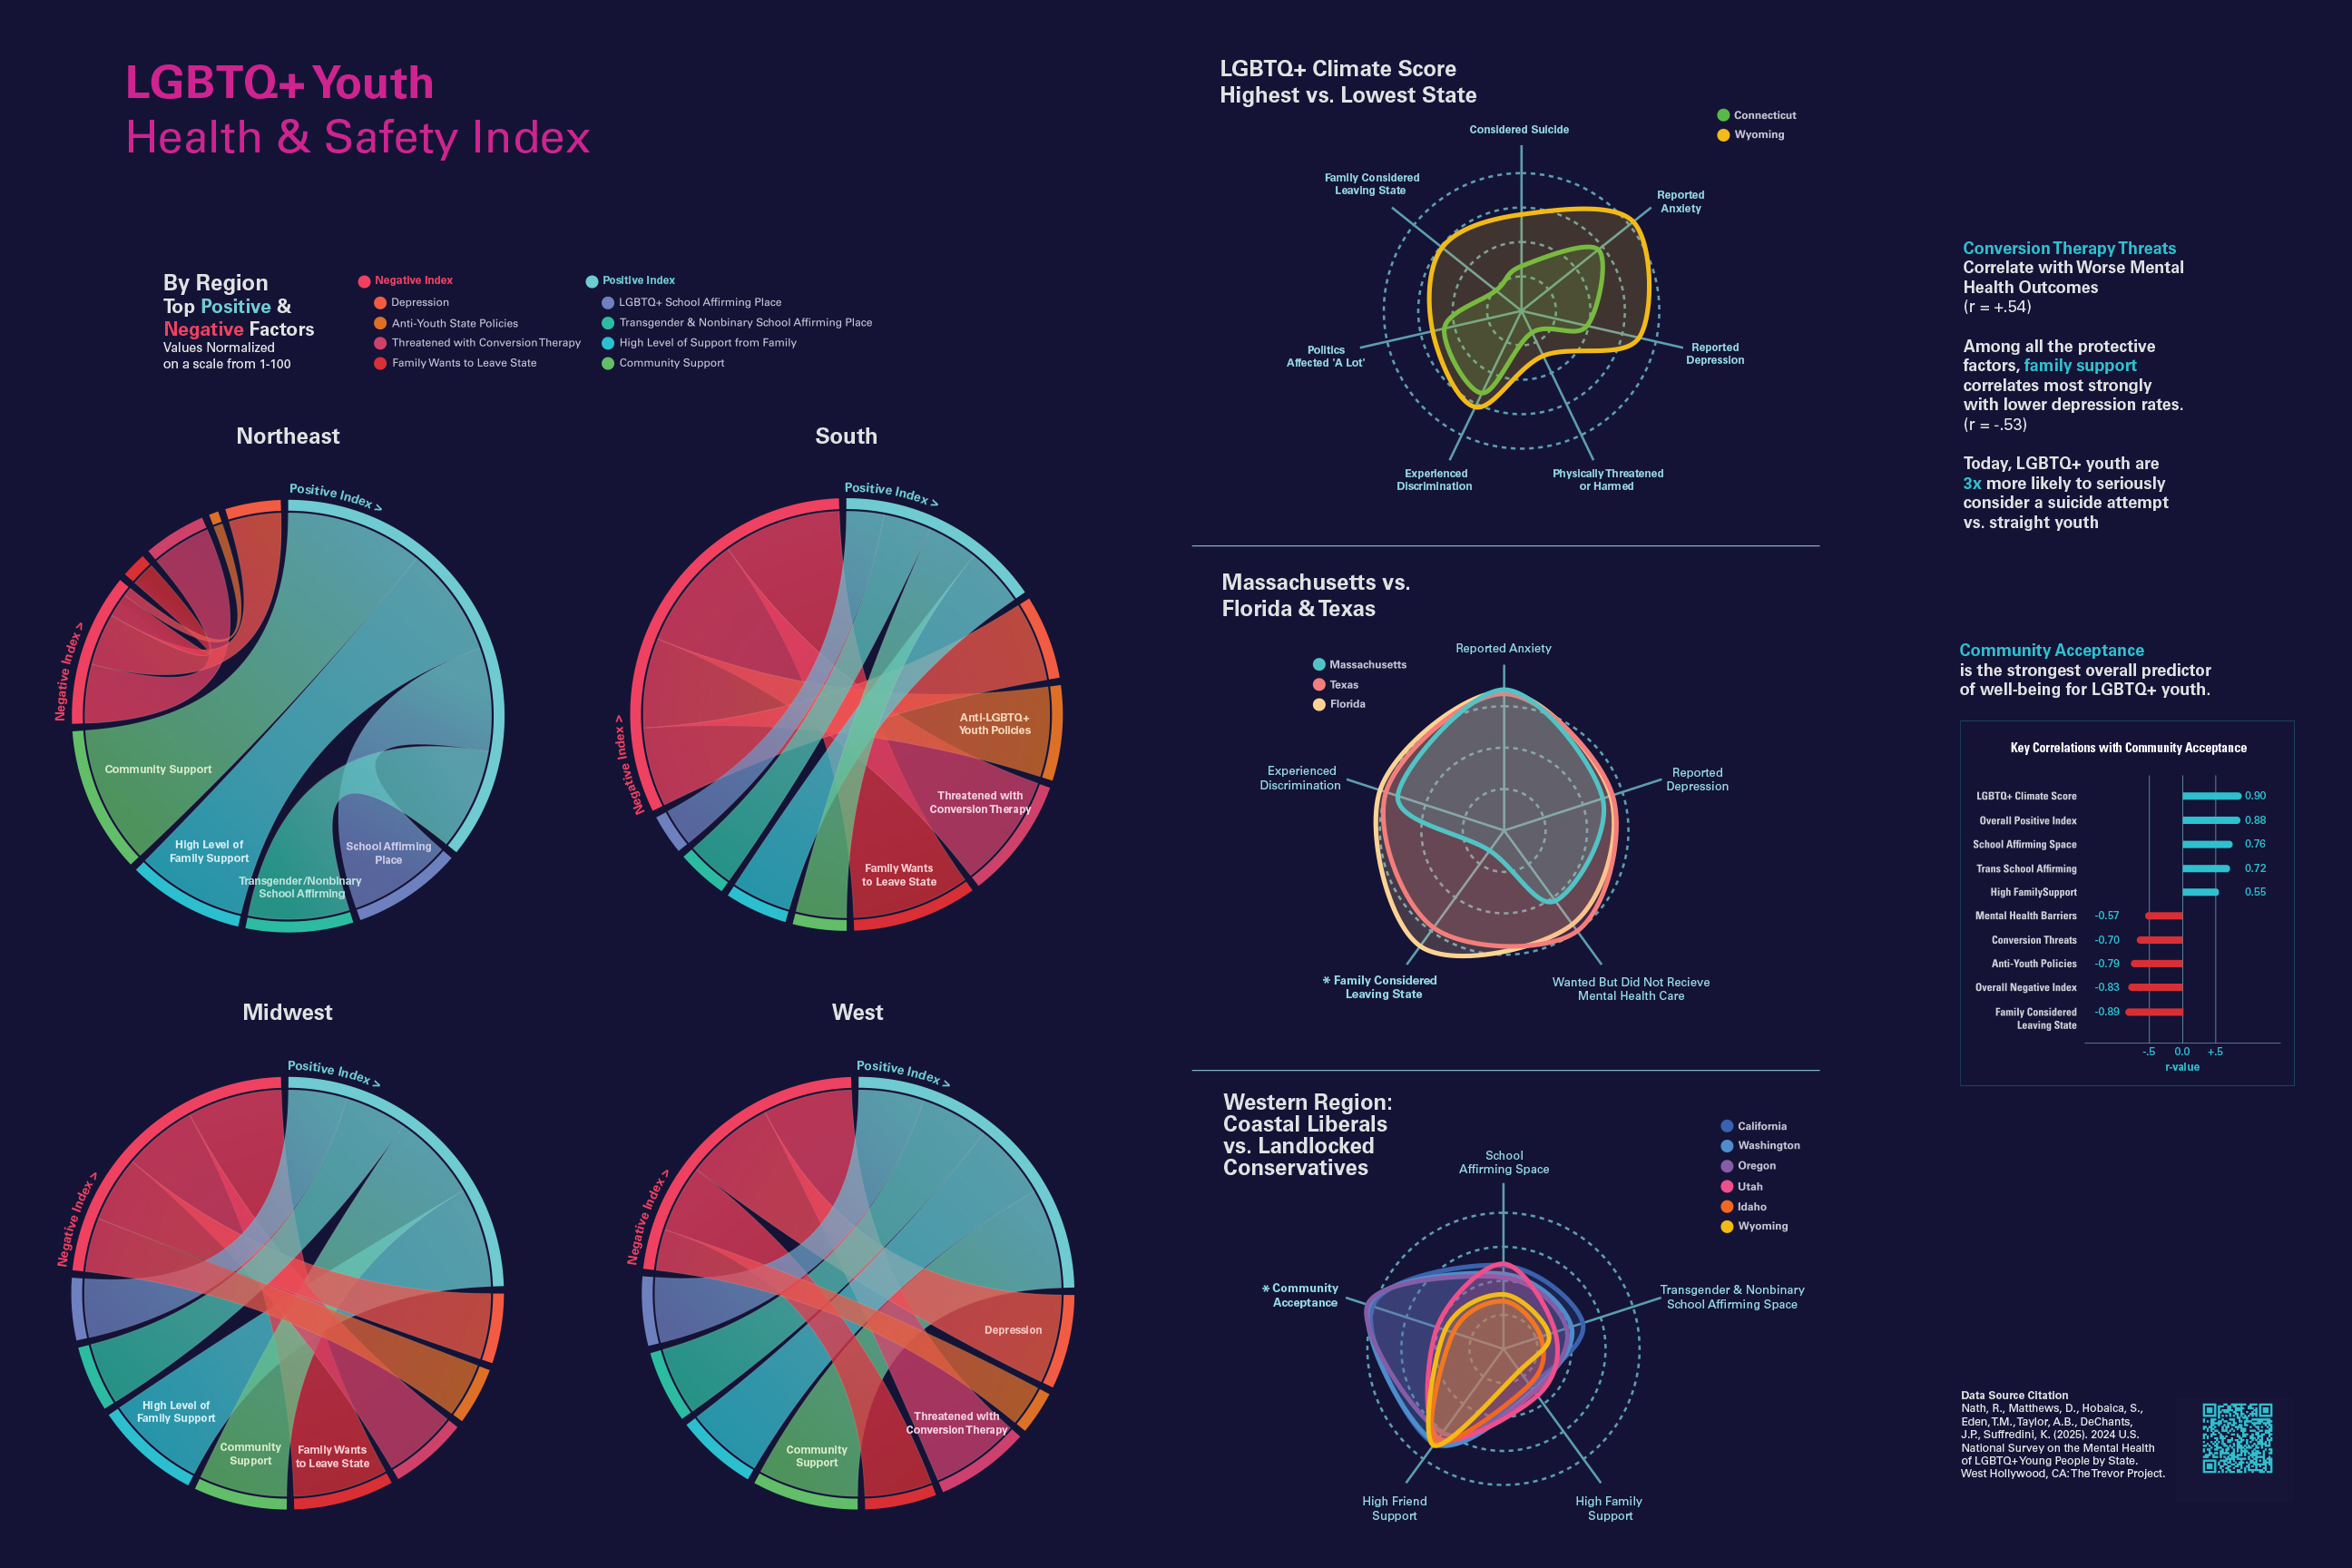
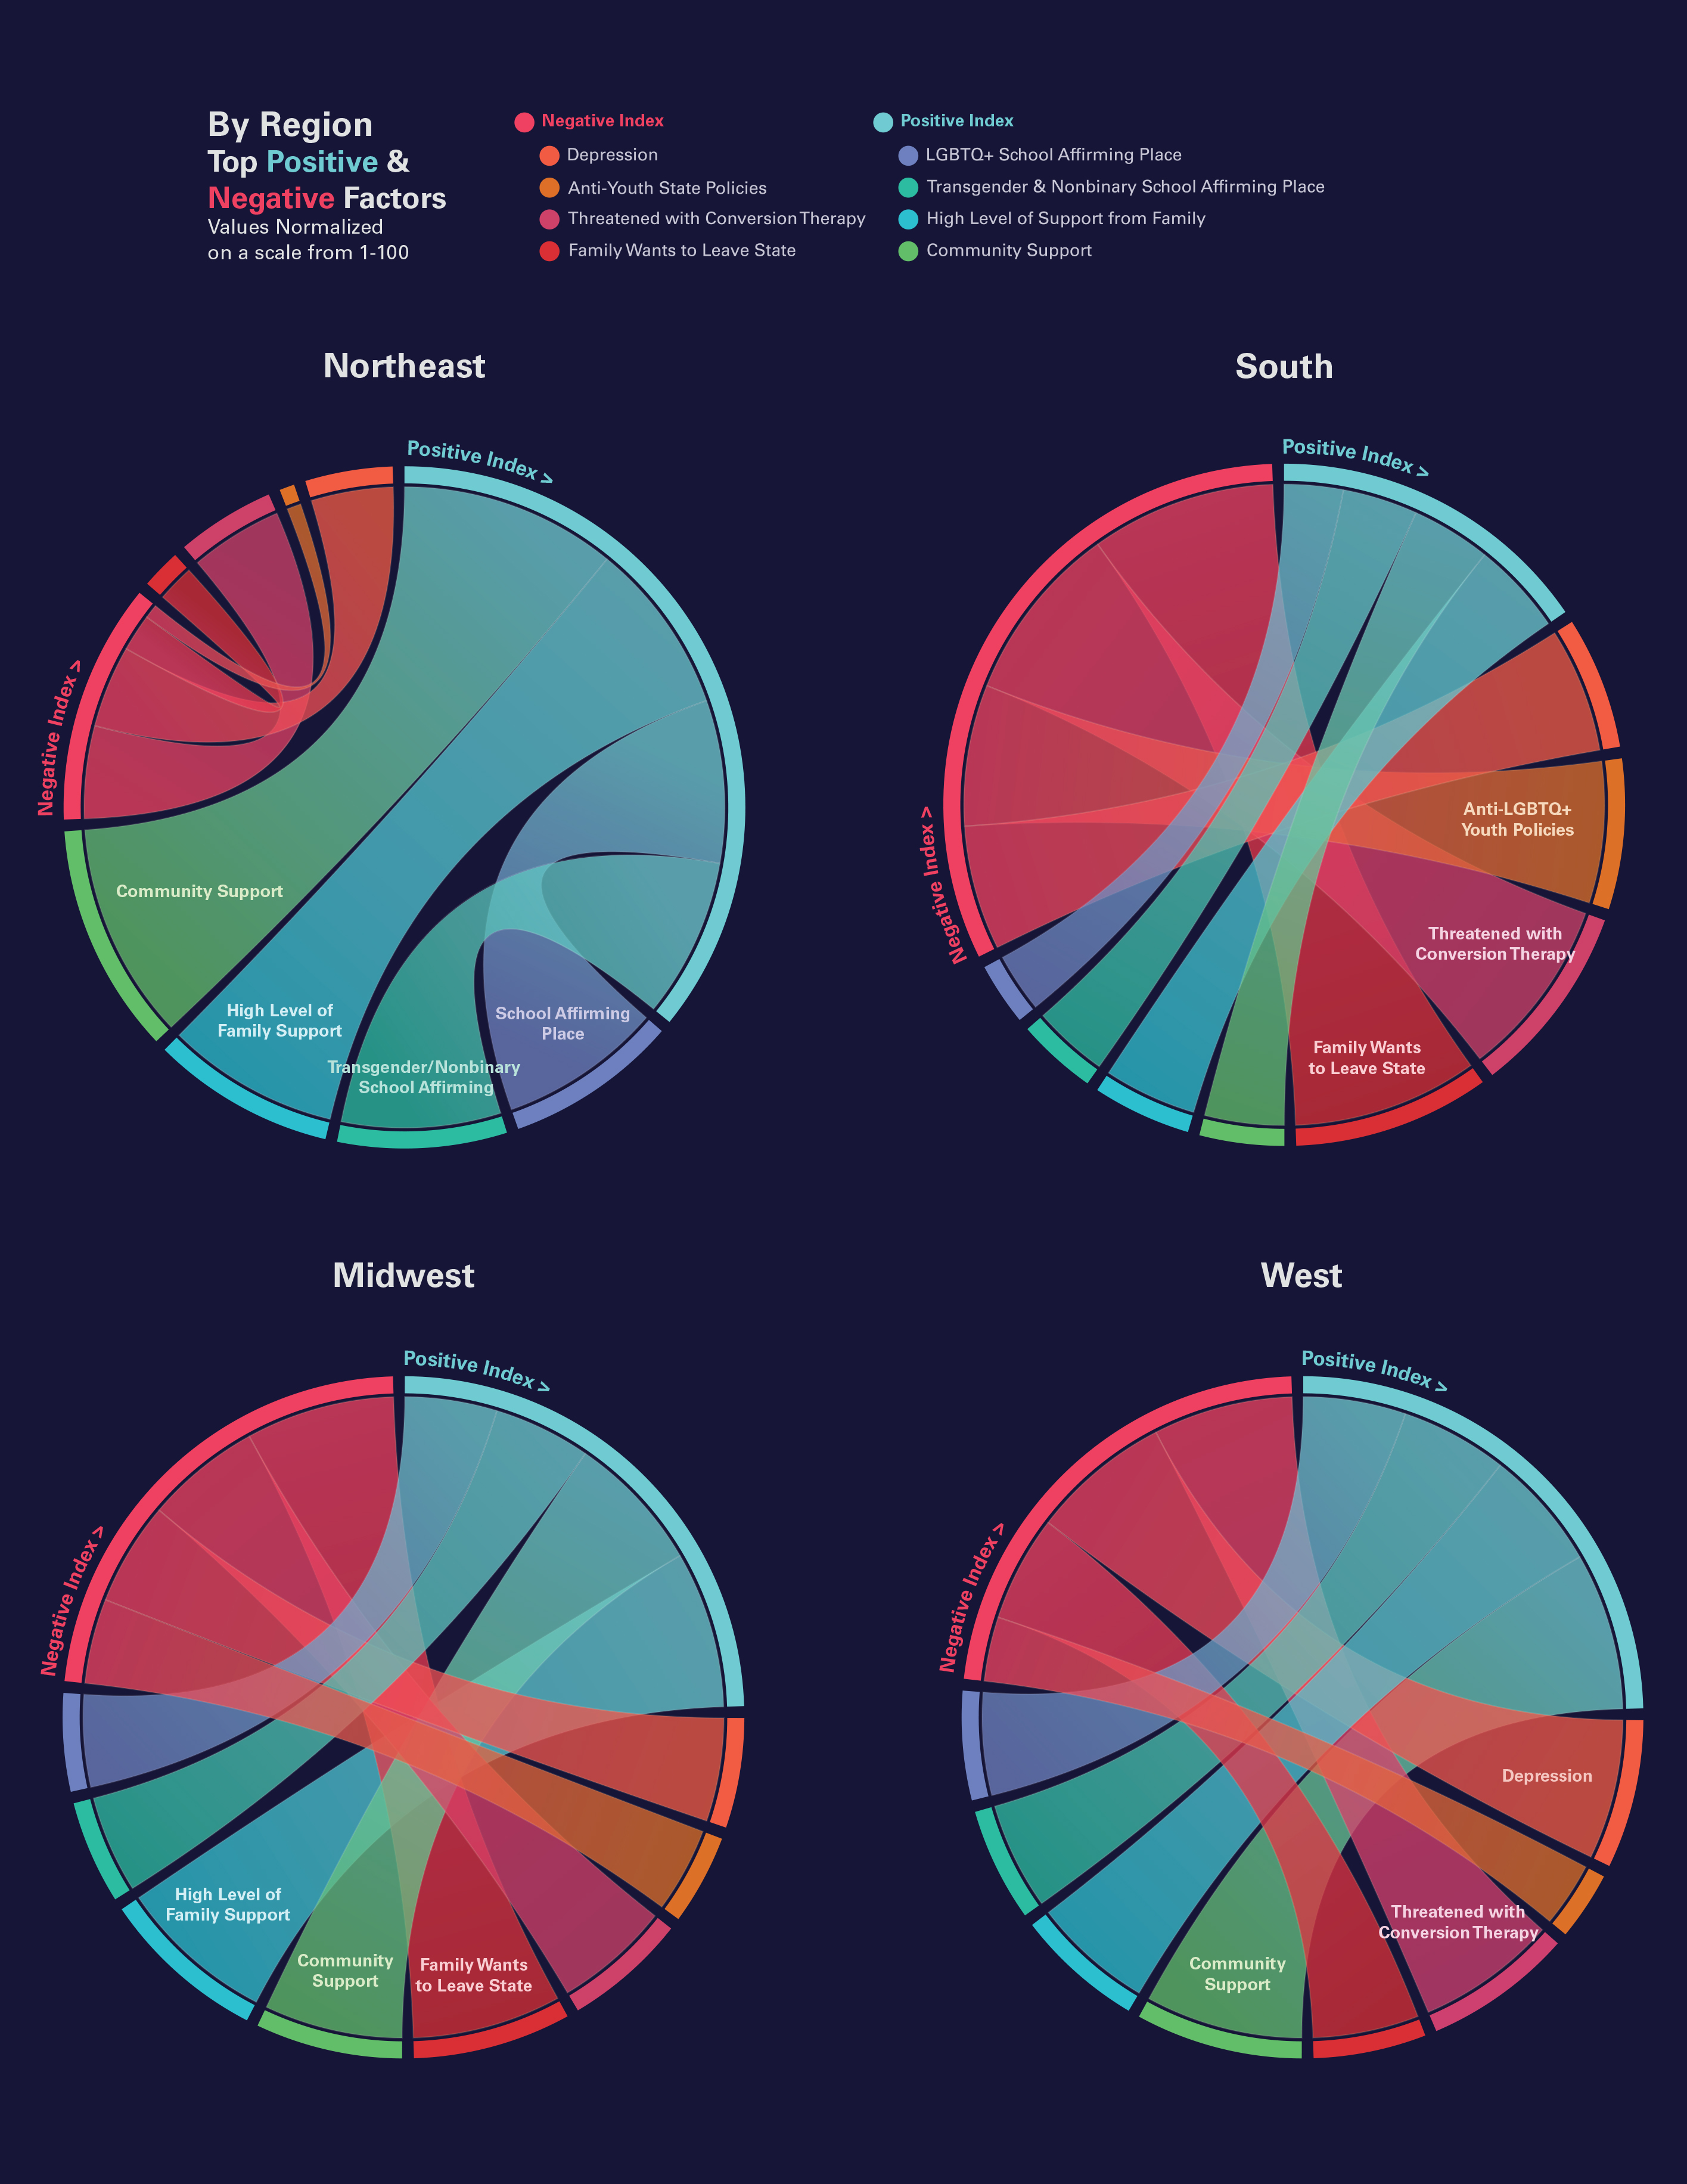
These chord diagrams visualize not only the key factors shaping LGBTQ+ youth well-being within each region, but also the sharp contrasts across those regions most notable between the northeast and the south. By mapping the strongest positive and negative contributors to each region’s indices, the diagrams make visible how some areas are anchored by protective forces such as family support, affirming schools, and community acceptance, while others are dominated by risks like anti-LGBTQ+ policies, conversion-therapy threats, or families considering leaving the state.
A chord diagram is particularly suited to communicate this because it highlights relationships rather than isolated values, allowing viewers to see at a glance how multiple conditions pull a region toward either a positive or negative overall climate. The circular structure emphasizes balance, tension, and interconnectedness, while the sweeping chords reveal how the weighting of supportive versus harmful factors differs from region to region. This format makes the geographic disparities in LGBTQ+ youth experiences both clear and compelling, giving form to the complexity behind each region’s health and safety landscape.
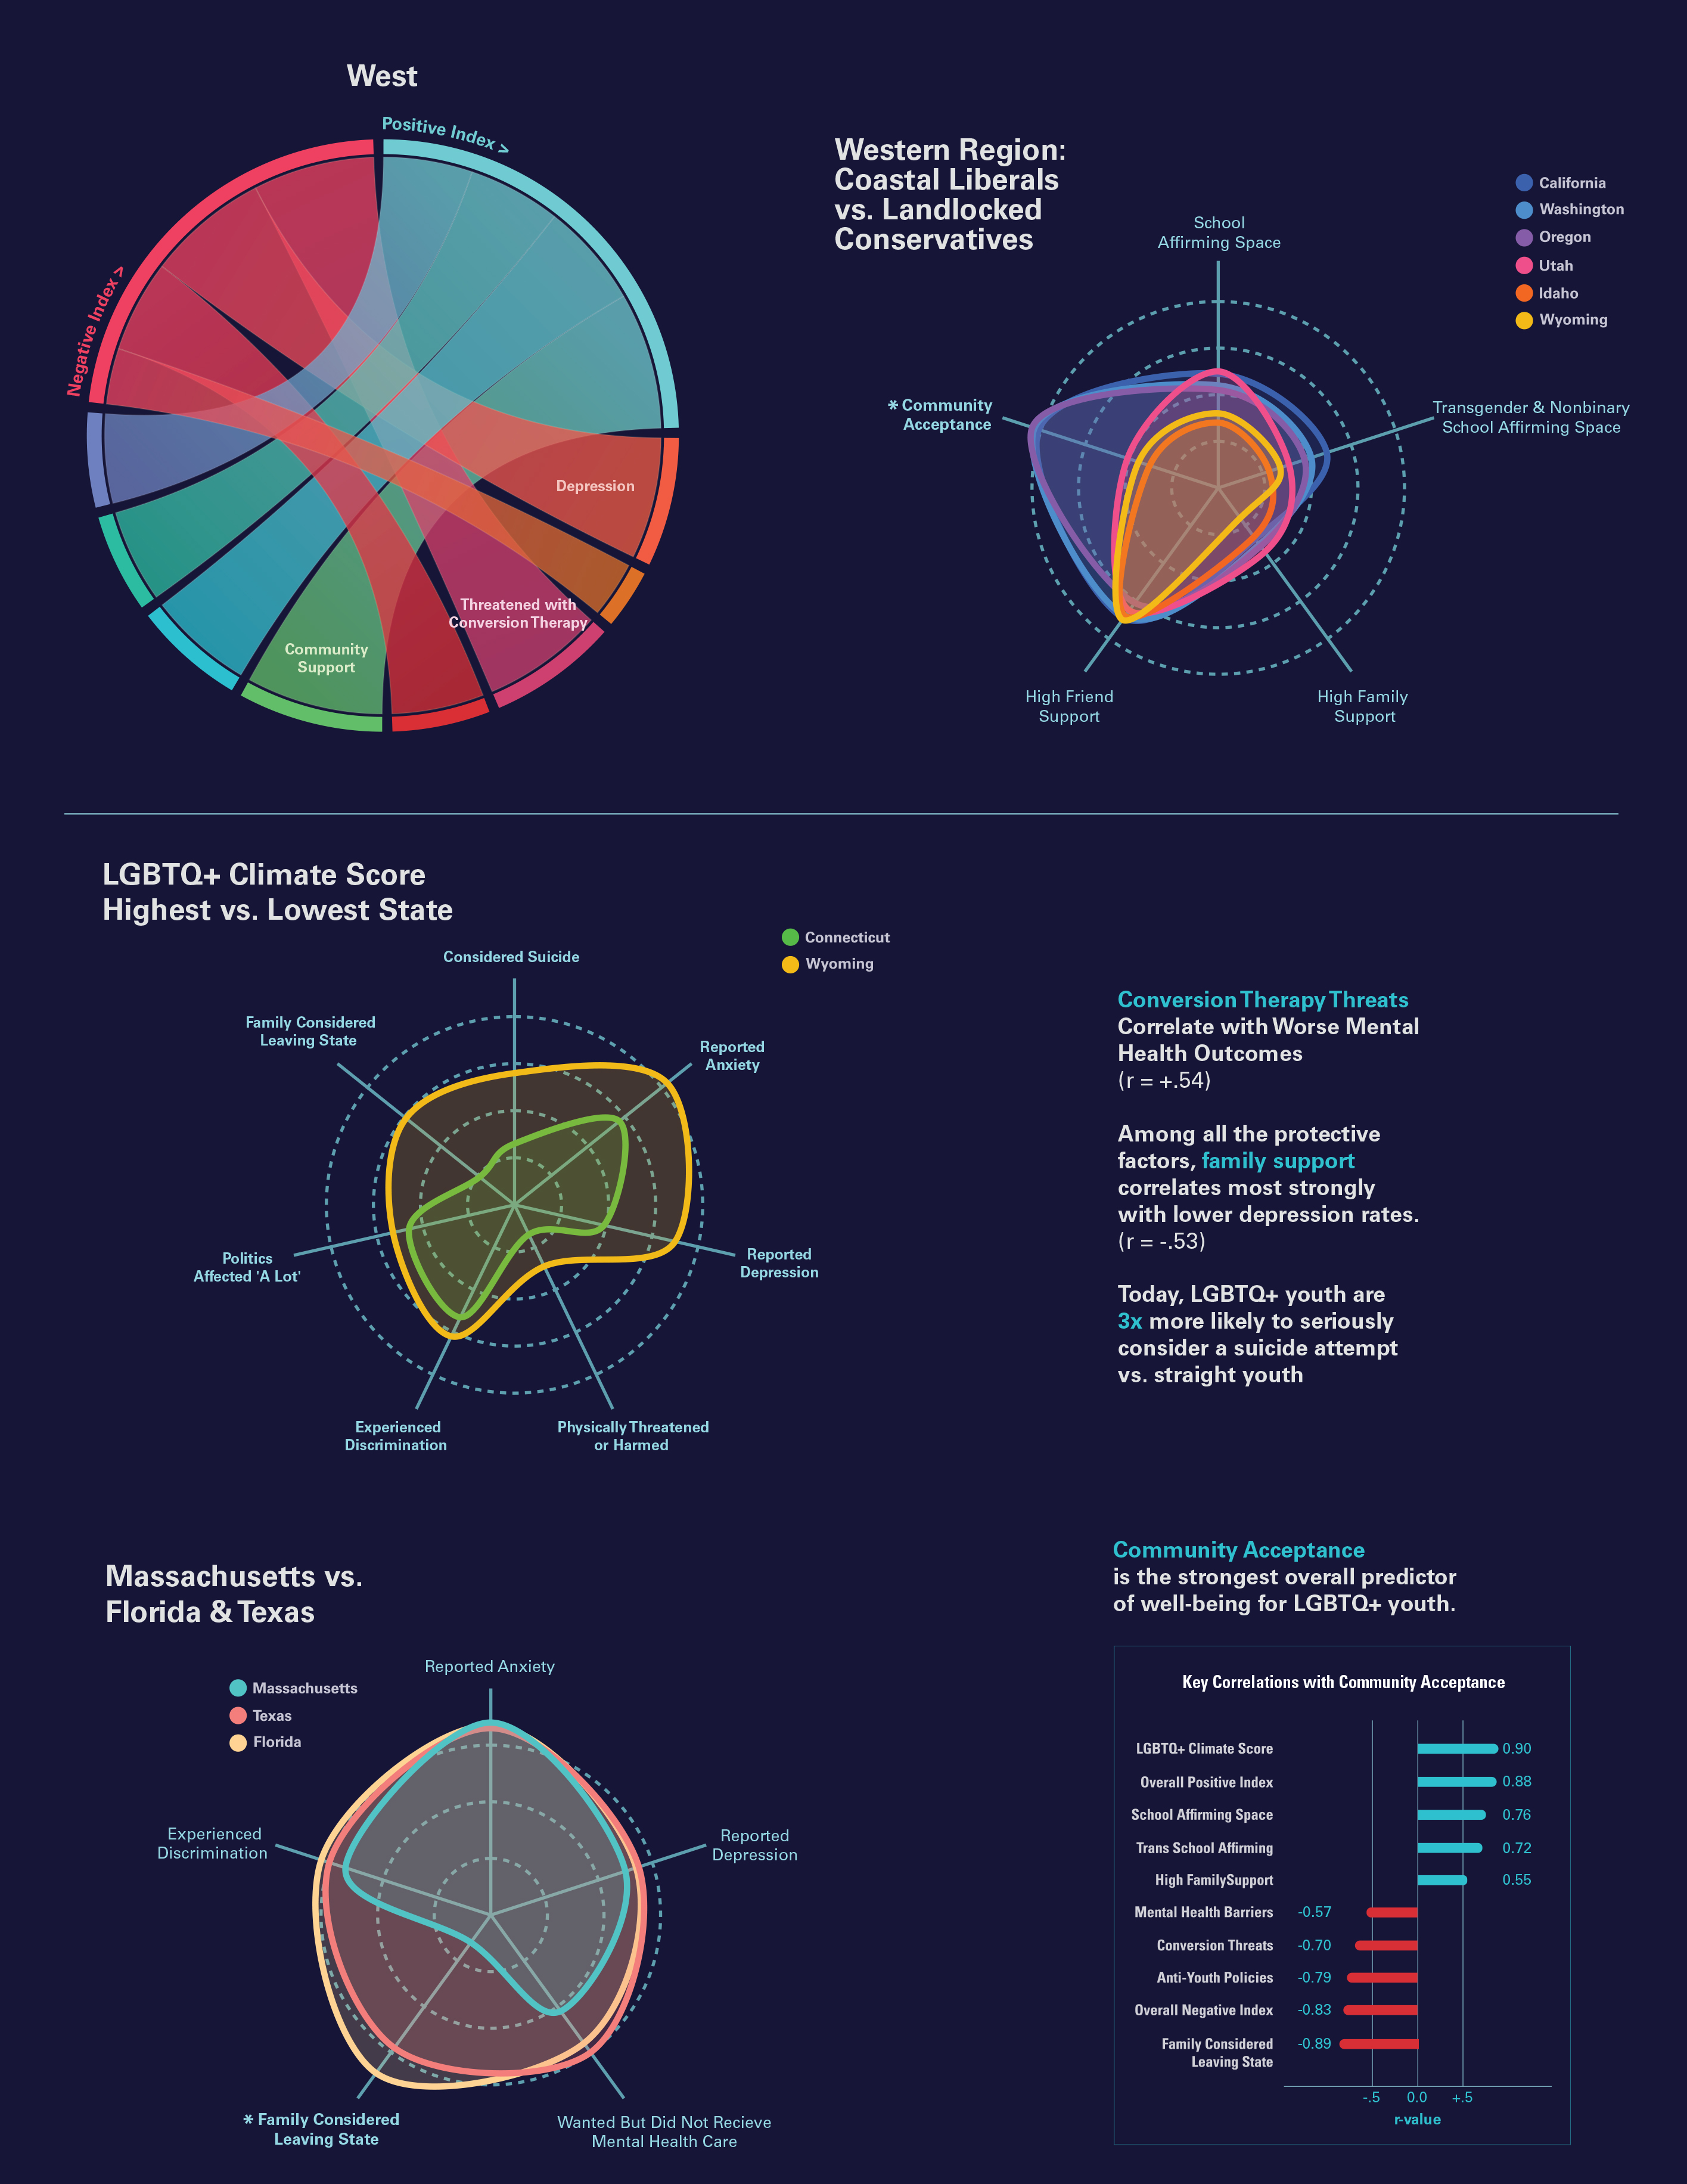
The radar, or radial area chart, is particularly effective for visualizing the complex interplay of protective and risk factors influencing LGBTQ+ youth well-being. By arranging multiple variables around a shared axis, the chart allows distinct profiles such as supportive versus hostile states or regions to be compared in a single, intuitive form. Each “shape” conveys the balance or imbalance among key factors like family support, community acceptance, and mental-health access. The circular format mirrors the holistic nature of lived experience, emphasizing that these factors do not operate in isolation but radiate outward and intersect. This makes the radar chart not only visually engaging but also conceptually resonant—transforming quantitative differences into expressive, organic forms that highlight both progress and disparity across regions.
This design focuses on regional comparisons and key state-versus-state comparisons. Several types of charts and graphs give viewers a better understanding of the factors and places where LGBTQ+ youth can feel more secure, supported and generally safe.
About the Process: First, data was researched, collected and formatted in Excel spreadsheets. Next, Flourish was used to intially visualize the radar charts and chord diagrams. Further work on the infographics and overall design was completed in Adobe Illustrator.
These chord diagrams visualize not only the key factors shaping LGBTQ+ youth well-being within each region, but also the sharp contrasts across those regions most notable between the northeast and the south. By mapping the strongest positive and negative contributors to each region’s indices, the diagrams make visible how some areas are anchored by protective forces such as family support, affirming schools, and community acceptance, while others are dominated by risks like anti-LGBTQ+ policies, conversion-therapy threats, or families considering leaving the state.
A chord diagram is particularly suited to communicate this because it highlights relationships rather than isolated values, allowing viewers to see at a glance how multiple conditions pull a region toward either a positive or negative overall climate. The circular structure emphasizes balance, tension, and interconnectedness, while the sweeping chords reveal how the weighting of supportive versus harmful factors differs from region to region. This format makes the geographic disparities in LGBTQ+ youth experiences both clear and compelling, giving form to the complexity behind each region’s health and safety landscape.
The radar, or radial area chart, is particularly effective for visualizing the complex interplay of protective and risk factors influencing LGBTQ+ youth well-being. By arranging multiple variables around a shared axis, the chart allows distinct profiles such as supportive versus hostile states or regions to be compared in a single, intuitive form. Each “shape” conveys the balance or imbalance among key factors like family support, community acceptance, and mental-health access. The circular format mirrors the holistic nature of lived experience, emphasizing that these factors do not operate in isolation but radiate outward and intersect. This makes the radar chart not only visually engaging but also conceptually resonant—transforming quantitative differences into expressive, organic forms that highlight both progress and disparity across regions.
Size: 36"x24" printed
© 2026 danielle currier